We have developed a GIS map that you can use on your mobile device to navigate the woodland and find out more about the varied habitats that we have at Leadburn Community Woodland.
To use the map you will need to install the QField App. This is free software that is available for Android, iPhone, Windows, Linux, MacOS from their respective app stores.
Once you have QField installed, here are the steps needed to load and use the Leadburn Interactive Habitat Map. Red annotations on the screenshots indicate where the app controls are. The screenshots are specific for Android and may vary on other platforms.
- Download the Leadburn Interactive Habitat Map zipfile (11Mb) to your device – leadburnukhab.zip
- Open the QField app on your device
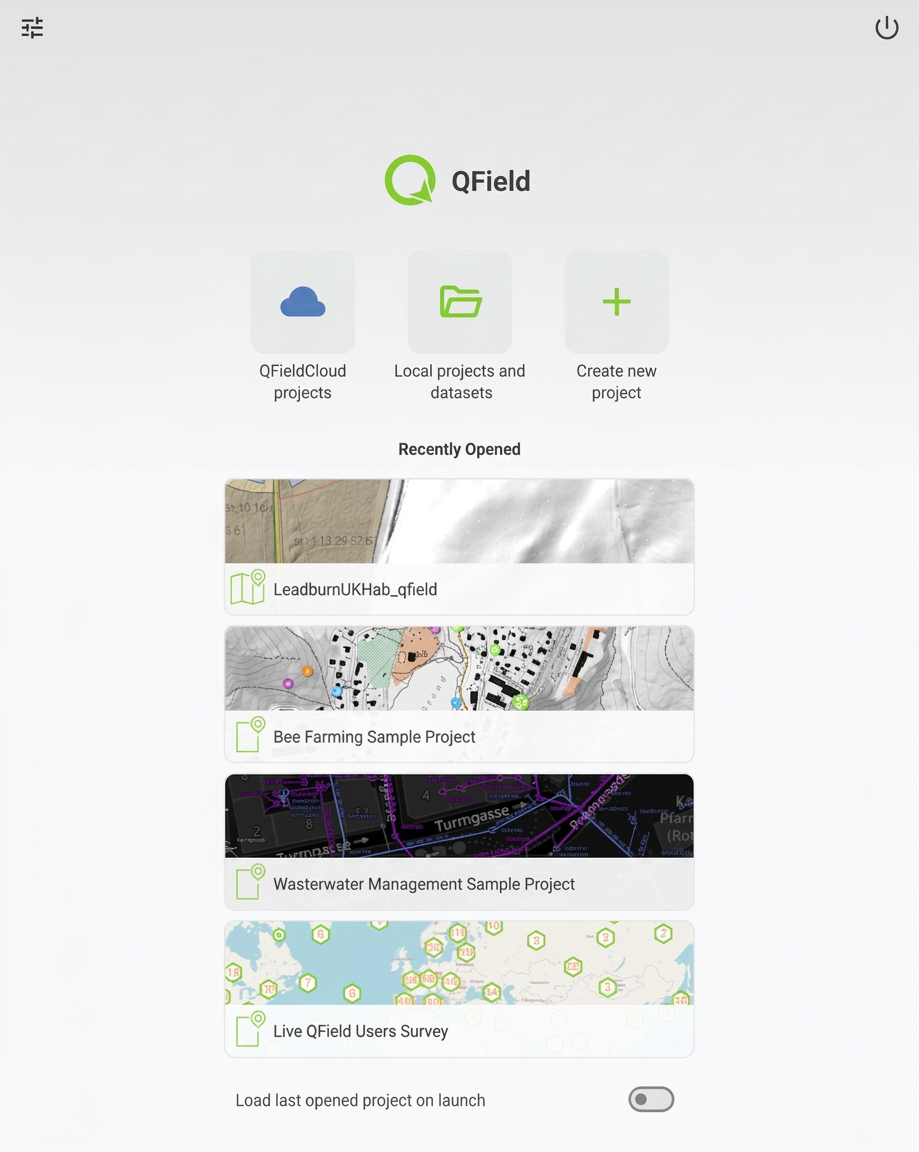
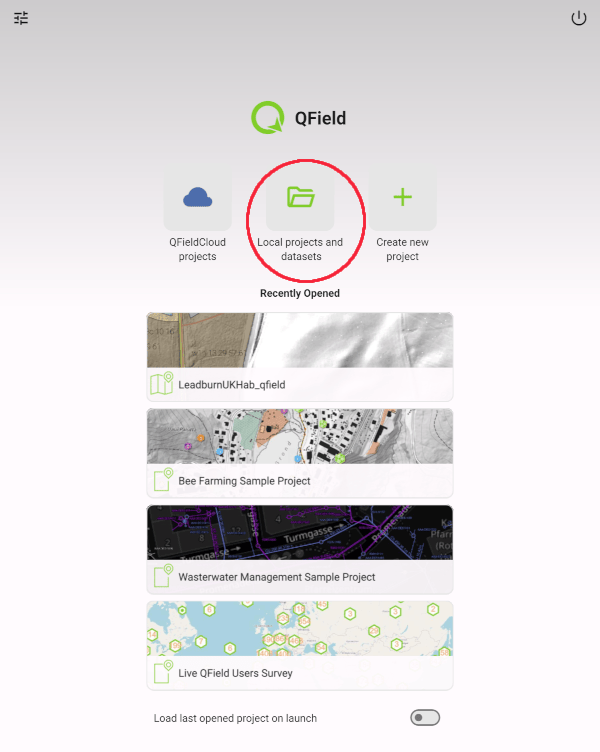
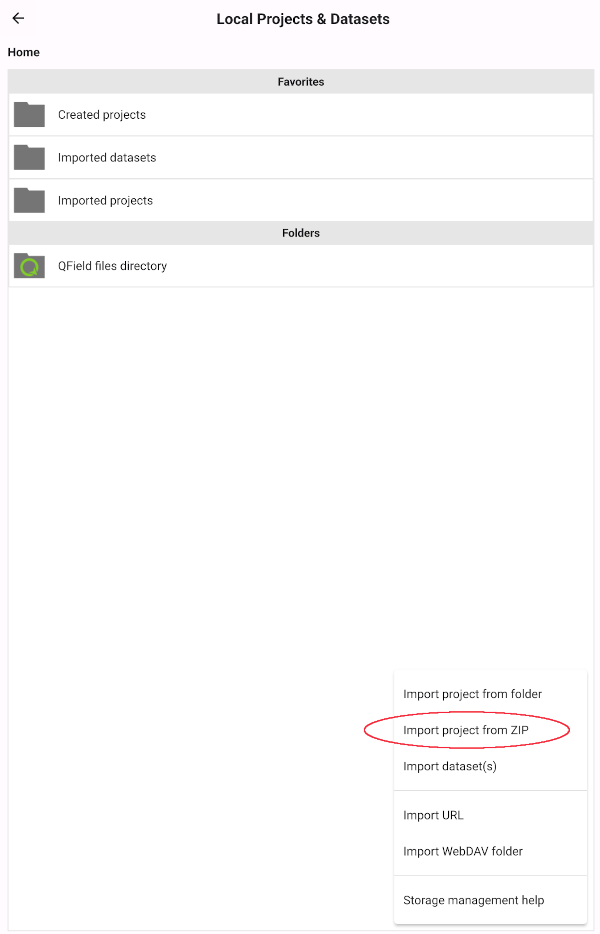
- Choose “Local projects and datasets”
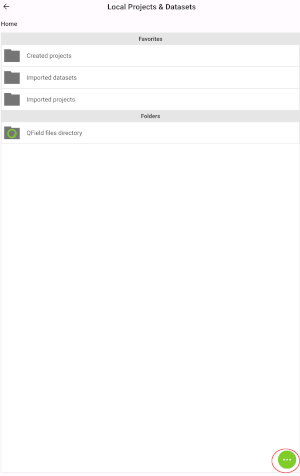
- Use “more options” (…) on the Local projects and datasets page
- Choose “Import project from zip” and select your leadburnukhab.zip file
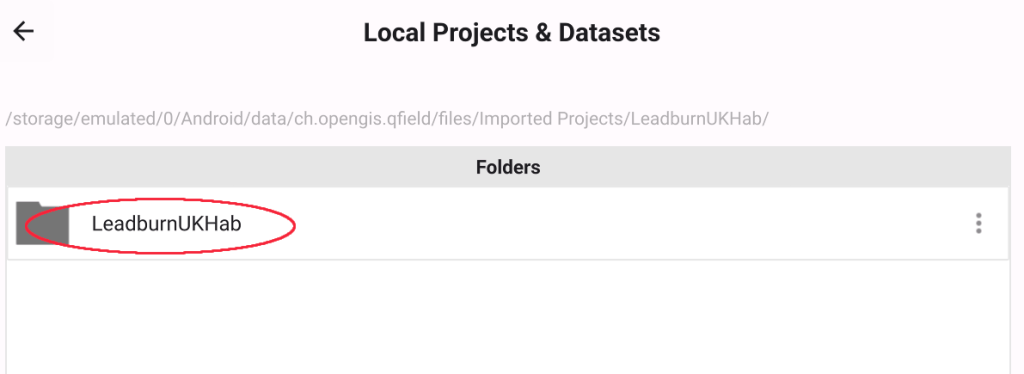
- The file will load and show you a folder named “LeadburnUKHab” under “Imported Projects”
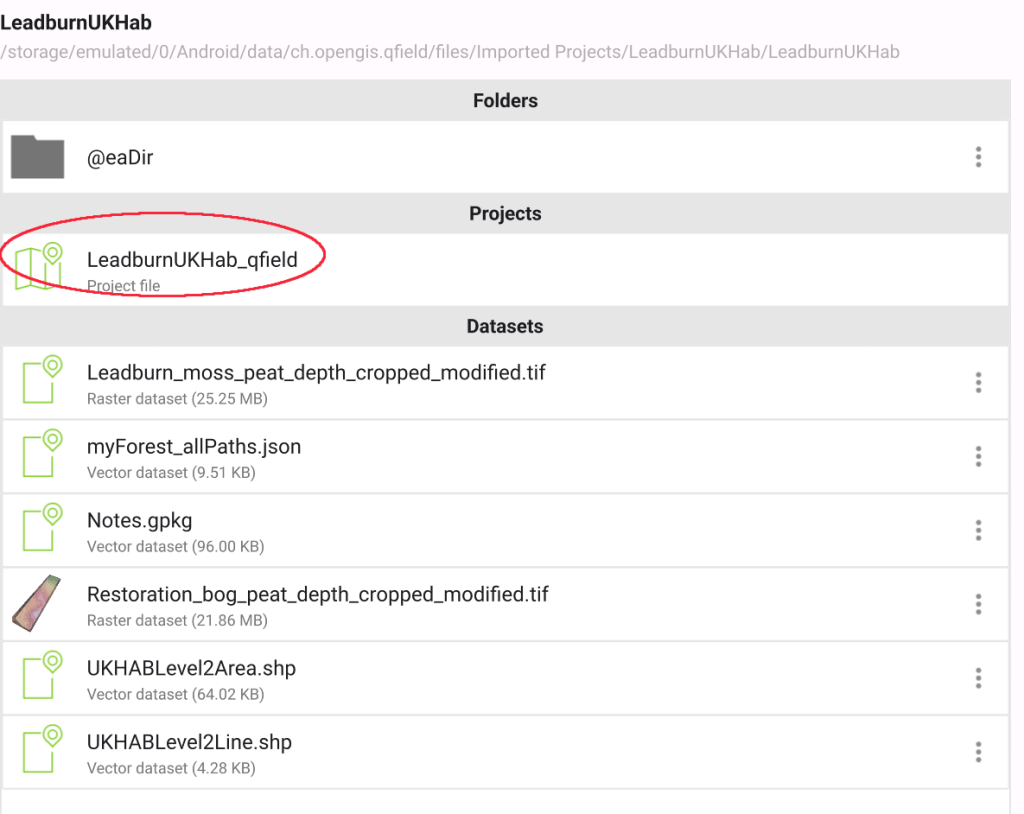
- Click on the LeadburnUKHab folder to see the contents, and then on the Project “LeadburnUKHab_qfield” to open the map
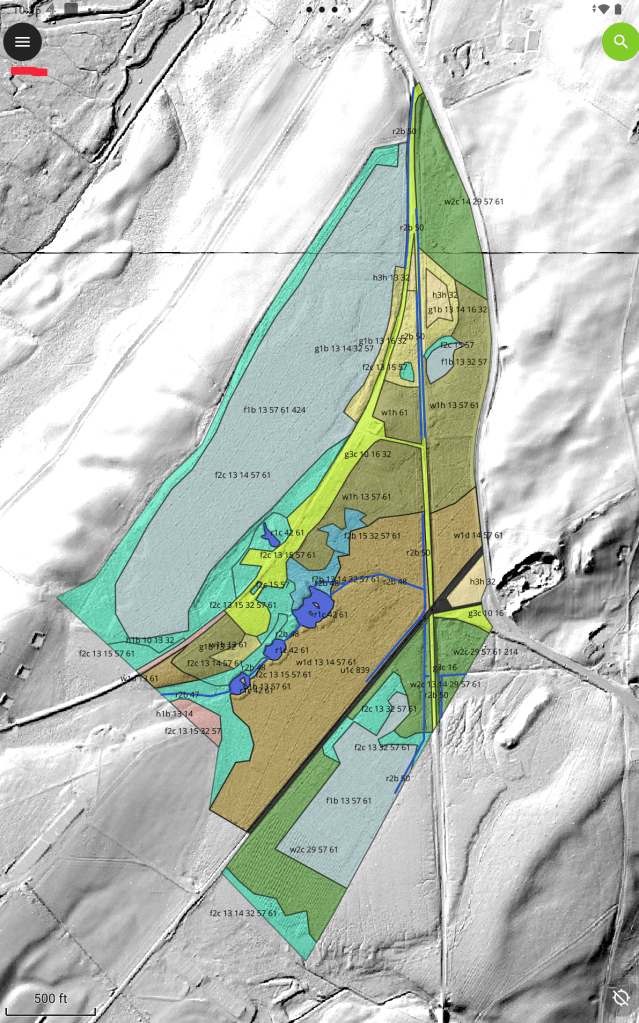
- The map will load. Use the top left “pancake” button to open the dashboard controls.
- The dashboard will open from the left of the screen. The dashboard shows the map “layers”. Each of the layers can be shown or hidden using the “eye” control. Clicking the chevron (>), opens the legend for that layer. The legend for the habitat layers gives information on the habitat code. The habitat is coded using the UK Habitat Classification. To hide the dashboard use the arrow key (top left).
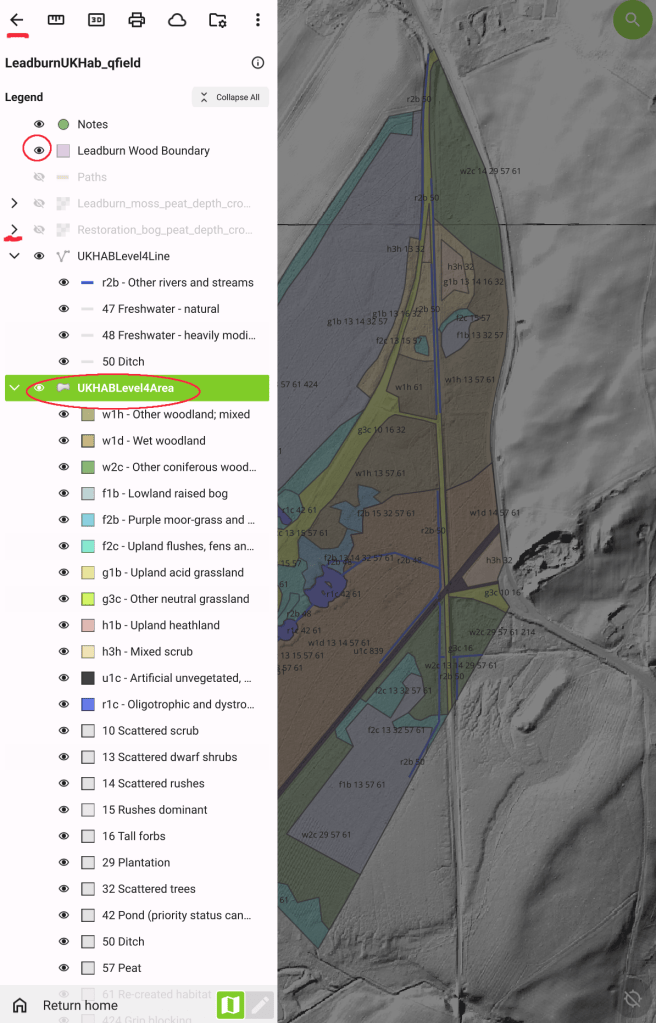
In addition to the habitats there are also these further map layers to explore:-
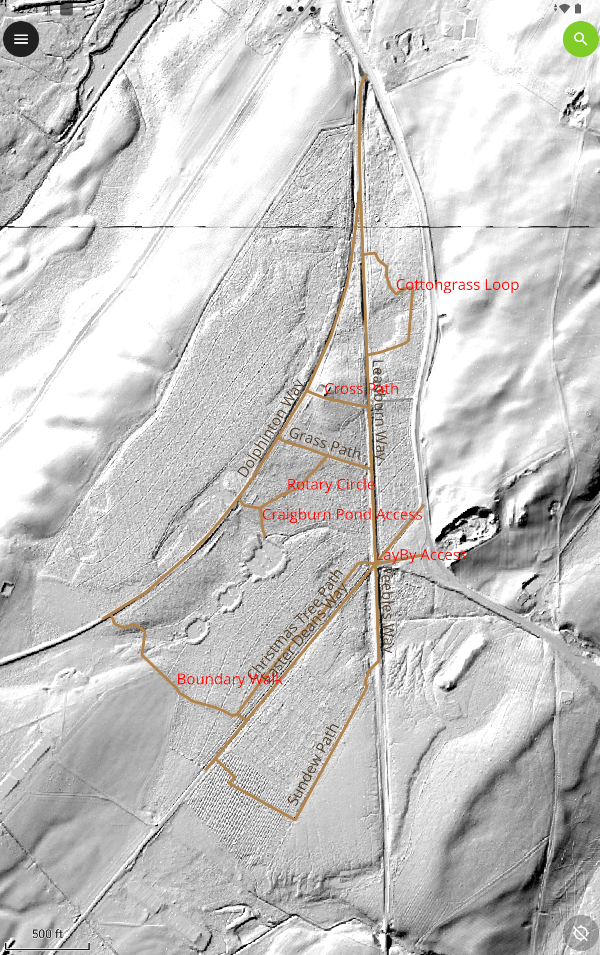
- Paths. The QField app will show your current position on the map so you can find your way around the woodland.
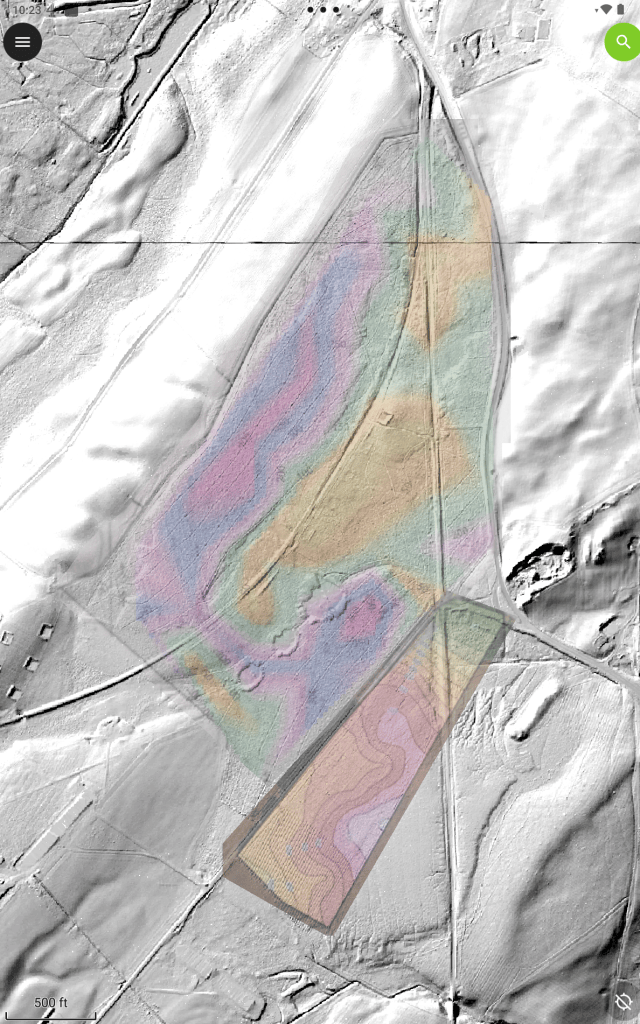
- Peat depths. Coloured contour maps of peat depths. There are 2 separate maps (done in different styles) covering Restoration Bog (south) and Leadburn moss and woodland (north). For Restoration Bog, the colours range from green for the shallowest peat depth at 50cm to pinkish grey at 500cm. For the northern section, the shallowest areas are a yellow shade around 50cm, through green, pink, blue and purple shades at around 400cm
- Lidar ground surface. This is the background layer shown in these screenshots, using data from the Scottish Remote Sensing Data Portal provided from the National Libraries of Scotland georeferenced map data.
- Leadburn wood boundary. Shows the full area extent of the woodland.
- Notes. This is an editable layer where you can mark a GPS position and annotate notes for any points of interest that you want to record in the woodland. Here are some more screenshots to show how to make that work:-
- Select the Notes layer in the dashboard, and then the edit function (green pencil at the bottom of the dashboard). This then allows points to be added – indicated by the green circle + button, bottom right of the screen
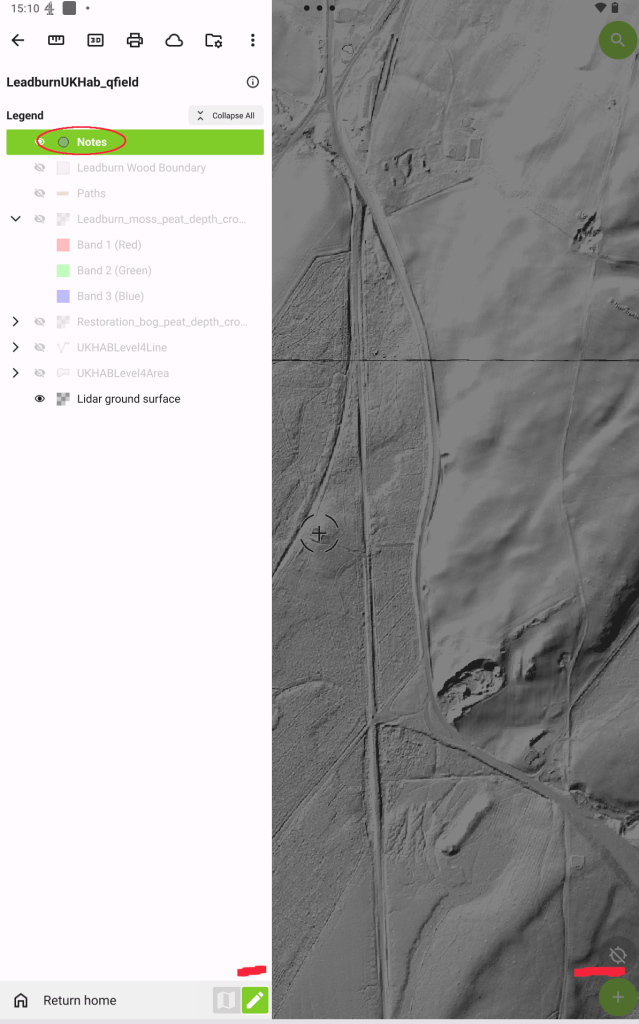
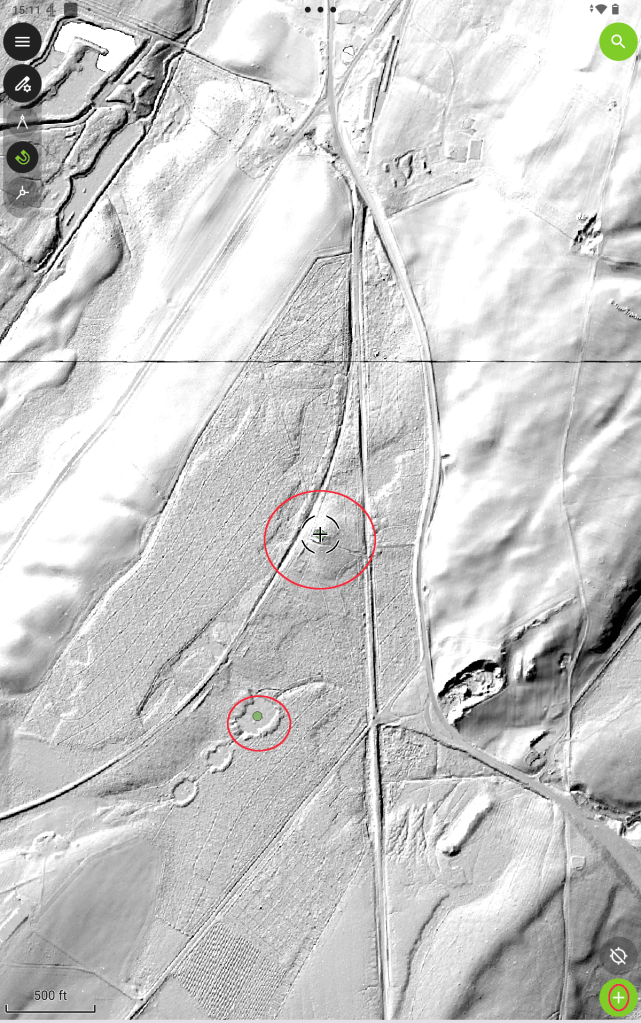
- A target circle will appear in editing mode. This is shown in the centre of the screenshot. Line this target up with the position that you want to record and click the green circle + button (bottom right). There will be a “teardrop” shaped marker also on screen (but not in these screenshots) that shows your GPS position. If you want to record your current position you need to line up the target circle with your GPS position. Positions already marked, plot as small green circles as shown:-
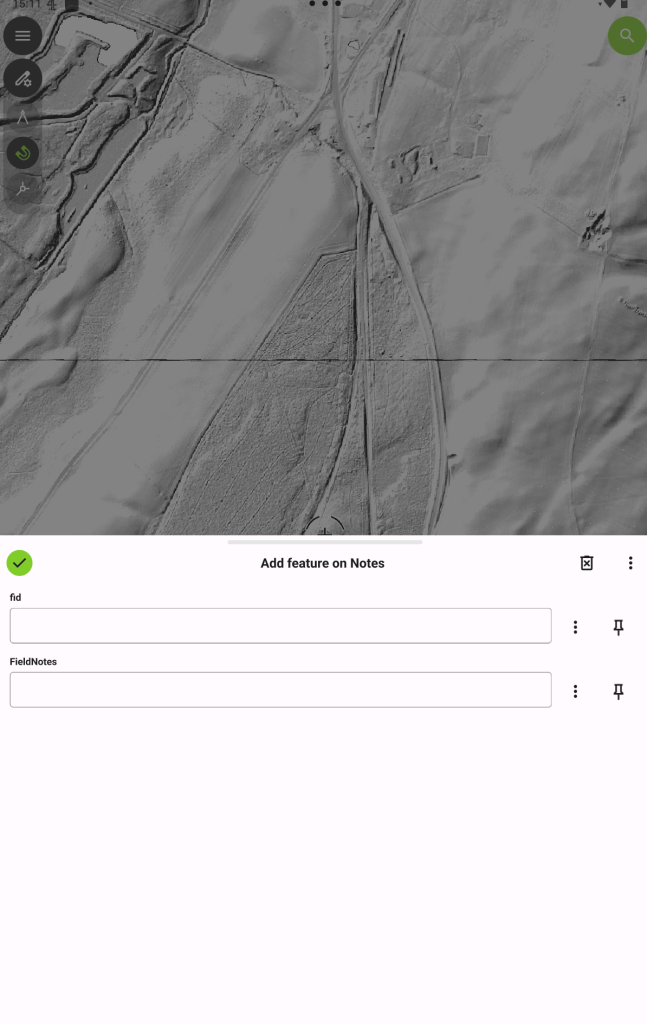
- When you add a point, a dialog will appear that allows you to enter some text (FieldNotes) describing why you have marked the point. It also asks for an ID number (fid). This must be a number you haven’t already used as an ID (a unique value).